
| Minimum Software Version | 8.18.10 |
| Solution(s) | Cases International ✓ Cases US ✓ Institutions ⨉ Counsel ✓ |
The Chart portal component allows users to display preconfigured charts in the portal, providing visual representations of worksheet data for analysis and insight.
The Chart component is used to surface visual analytics that have already been created within a project. Charts must be configured in advance using the Data tables and charts functionality in the project before they can be selected for portal display.
Once added to a portal page, the Chart component enables portal users to view data visually and, depending on permissions, explore the underlying data in different formats, such as tables or the source worksheet.
Step 1: Create Charts in the Project
Before configuring the Chart component:
- Open the project and navigate to Data tables and charts.
- Create the required chart based on worksheet data.
- Save the chart so it is available for selection in the portal.
Important:
Only charts that already exist within the project can be displayed in the portal.
Example:
Create a bar chart showing the number of procedural steps by status.
Step 2: Add a Chart Component
- Open the Portal Builder.
- Add the Chart component to the desired portal page.
- Open the Properties tab to configure the component.
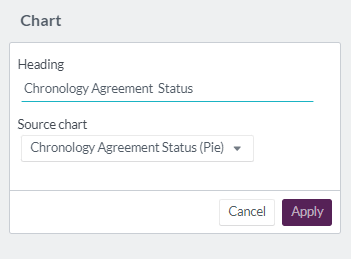
Step 3: Configure Chart Properties
Configure the following options:
| Option | Explanation |
|---|---|
| Heading | Heading text for the Chart component (maximum 100 characters). |
| Source chart | Required. Select an existing chart created in the project’s Data tables and charts section. |
Example:
Configure a Chart component with the heading “Case Status Overview” using a previously created status breakdown chart.
Step 4: Portal User Chart Interaction
When viewed by portal users, the Chart component displays the selected chart along with three interactive icons:
| Icon | Function |
|---|---|
Source worksheet | Links to the source worksheet where the data is stored. Appropriate user permissions are required to view the source information.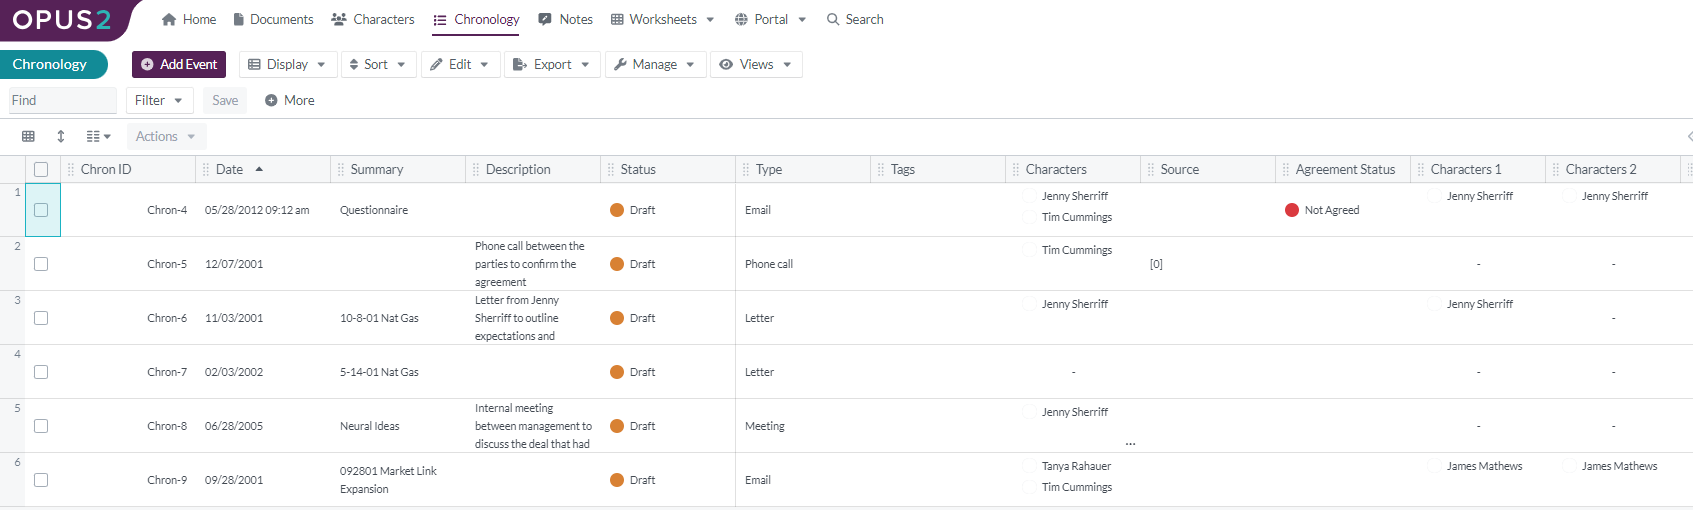 |
Chart view | Displays the information in a graphical chart format.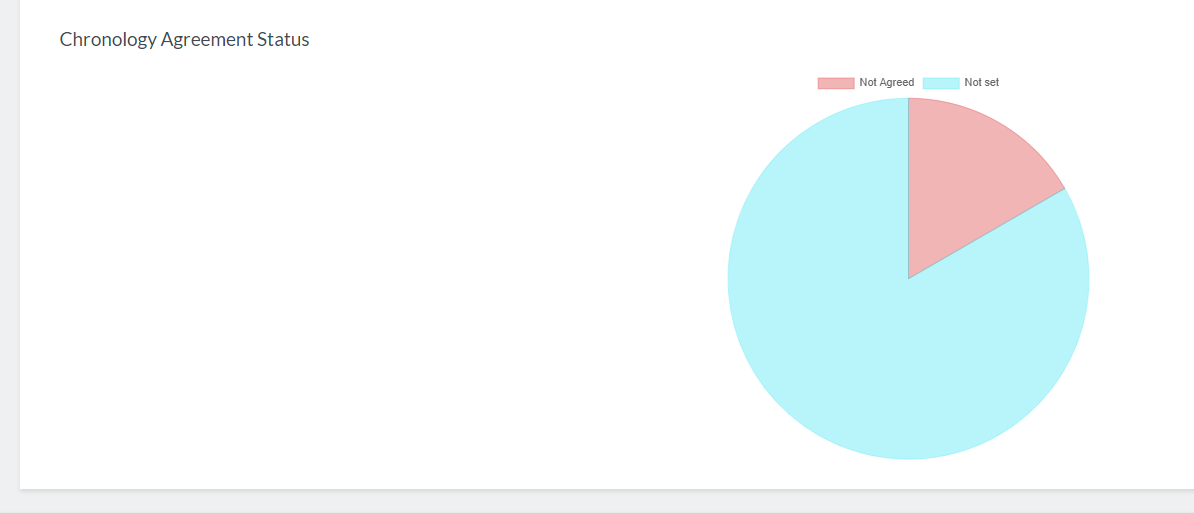 |
Table view | Displays the same data in a tabular format for detailed review.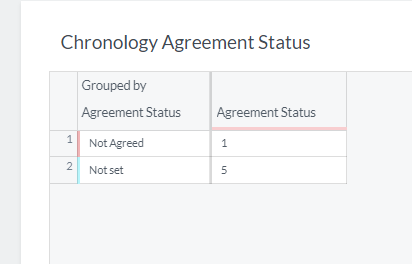 |
Portal users can switch between visual and table-based views to better understand the data.
Example:
A portal user toggles from chart view to table view to see exact numerical values behind the visual summary.
Display example of 'chart' component: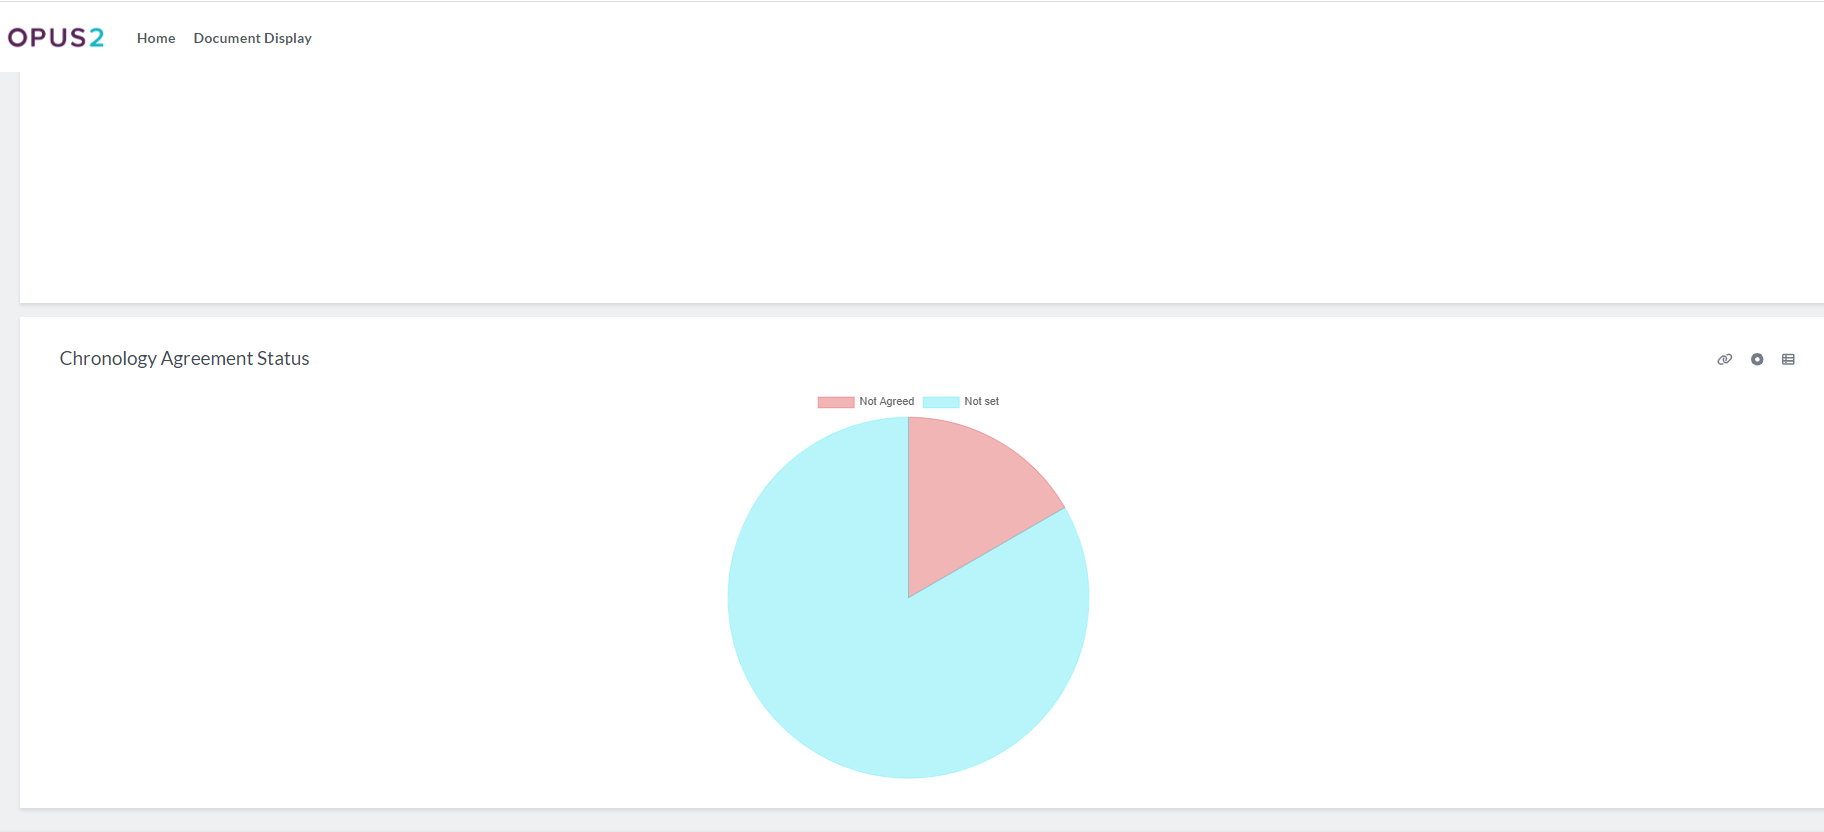
Related Links
Use the Chart component to enhance your portal with meaningful data visualizations, helping portal users quickly understand trends, patterns, and key insights.